Website user guide
The archive is accessed by means of a website where a two depth level approach has been implemented: 1) a general view with the list of all earthquakes and 2) a more detailed view showing all the archived items about a selected earthquake.
The layout adopted is strongly inspired by the website designed and implemented for the European archive AHEAD, so they both shares most of the interface elements.
General view
The general view is used as an index to access the archive content and features both an interactive map with a plot of the epicentres, and the corresponding list of earthquakes. It is subdivided into two sections: “Earthquakes” and “Fakes”.
In the "Earthquake" section (Fig. 1) two colours are used, red and orange, to identify respectively the earthquakes included in the Global Historical Earthquake Catalogue (GHEC), and the earthquakes not included in GHEC that were previously interpreted as having M>7 by some catalogues and retained in the archive for inspection.
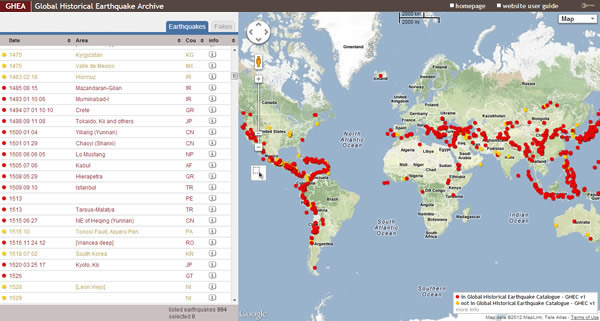
Fig 1 - Global Historical Earthquake Archive: general view
By moving the mouse pointer over an epicentre, a label will appear with the earthquake date (Fig. 2); by clicking on the epicentre a popup window will appear with all the archived items about the selected earthquake.
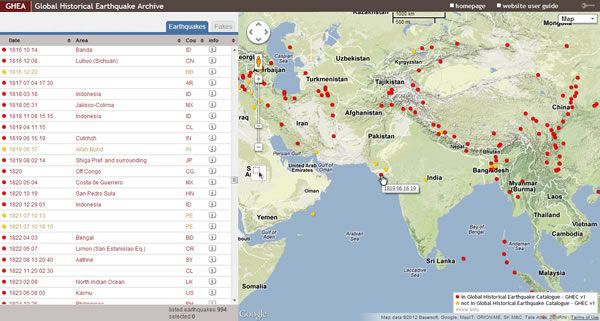
Fig. 2 - Selection of an earthquake using the overview map
The user can select more than one earthquake at once by using the “multi-selector tool” ( ![]() ) and drawing a rectangle over the map (Fig. 3). All the epicentres falling into the area will be automatically selected.
) and drawing a rectangle over the map (Fig. 3). All the epicentres falling into the area will be automatically selected.
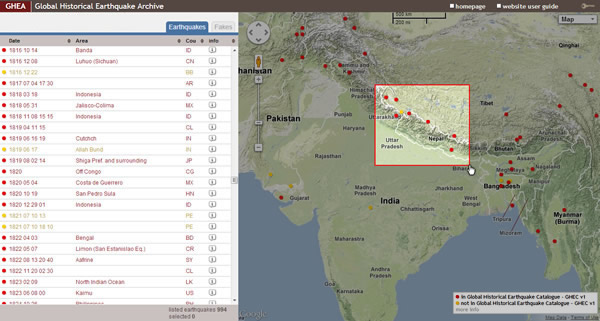
Fig. 3 - Using the multi-selector tool: all earthquakes falling into the rectangle will be selected
One can inspect an earthquake also through the list: by moving the mouse pointer over a row, the corresponding earthquake will be highlighted on the map; by clicking on a row the earthquake will be selected, the line will be highlighted in yellow and the corresponding epicentre on the map will be circled in black.
To open the popup window to access the archive items about the earthquake, the user can click on the “info icon” (![]() ).
).
By default the table is sorted by date, but it can be sorted differently clicking on other two table headers, “Area” of maximum effects and “Cou”, the country where the earthquake epicentre falls. (This refers to modern territories; at the time of the earthquake the country may have been different).
To facilitate the analysis of a set of previously selected earthquakes, the user can isolate them in the list (Fig. 4) by clicking the “isolator tool” (![]() ) icon. The tool works as an ON/OFF switch: to go back to the complete list of earthquakes, it has to be clicked again.
) icon. The tool works as an ON/OFF switch: to go back to the complete list of earthquakes, it has to be clicked again.
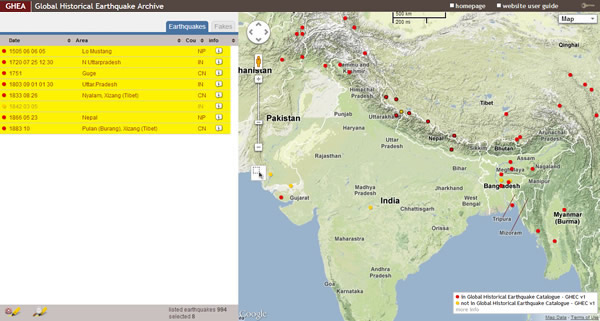
Fig. 4 - Using the isolator-tool: only selected earthquakes are shown in the table
To clear the selected earthquakes, one can click the “clear tool” (![]() ).
).
In the “Fakes” section fake earthquakes are represented with a blue cross on the map.
Detailed view
The detailed view will open the archive content for the selected earthquake. It is subdivided into two sections: a) “archive”, with the complete list of items archived and b) “catalogue”, with the parameters selected to be included in GHEC.
The webpage shows on the right the studies related to the selected earthquake, while on the left an interactive map centred on the area of maximum effects appears.
In the first tab, labelled “Archive” (Fig. 5), all the archived studies are represented in a reverse chronological order of publication and identified by the short citation, which only contains the author and the year of publication.
The selected study for GHEC is highlighted in yellow.
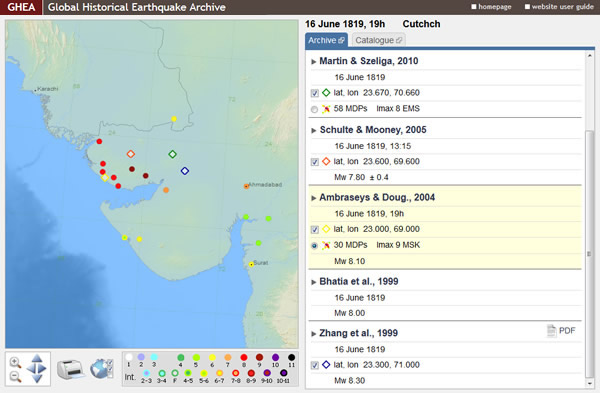
Fig. 5 - Detailed view of the Archive contents related to
the 16 June 1819 earthquake, Cutchch (India)
The complete bibliographical citation of the study can be accessed clicking on the short citation; by clicking again on the short citation the full reference will be hidden.
All the relevant parameters retrieved from the study are reported: the date, the epicentral coordinates, the available MDPs (Macroseismic Data Points) and their corresponding scale, the epicentral intensity, the depth and the magnitude. Whenever available, magnitude uncertainty is reported also.
The user can interactively show on the map epicentres and MDPs from a study by clicking on the activation button (![]() ) on the left of the corresponding parameter. For copyright reasons, MDPs are displayed on the map only, and no public download is available.
) on the left of the corresponding parameter. For copyright reasons, MDPs are displayed on the map only, and no public download is available.
If the copyright covering a study allows a free reproduction over the Internet, the complete text can be downloaded as a PDF file (Fig. 6); otherwise a link to a website containing the study is presented, if available (Fig. 7).
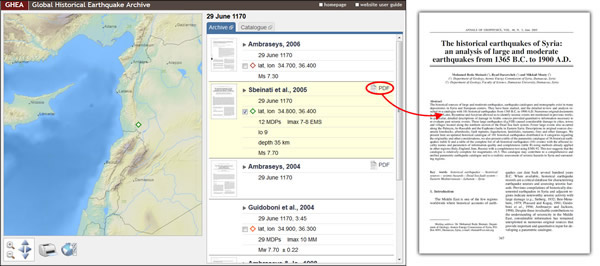
Fig. 6 - A downloadable PDF of an archived study: Sbeinati et al. (2005)
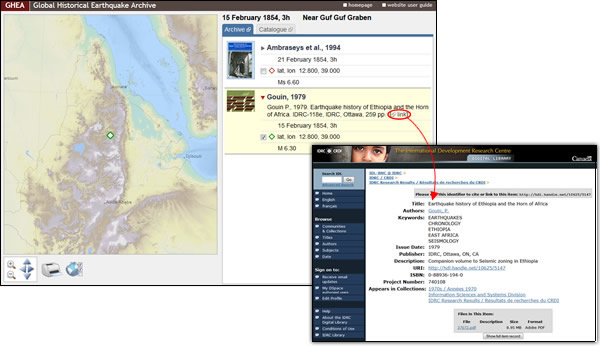
Fig. 7 - Link to an external digital library
giving public access to the whole volume by Gouin (1979)
The map can be panned and zoomed and can be further customised by clicking the map customisation icon
(![]() ). Users can change the rendering type of the DEM (Digital Elevation Model) (none, black and white flat shading, hill-shading, and colourful hill-shaded) and can plot temporarily a symbol on the map by entering the geographical coordinates.
). Users can change the rendering type of the DEM (Digital Elevation Model) (none, black and white flat shading, hill-shading, and colourful hill-shaded) and can plot temporarily a symbol on the map by entering the geographical coordinates.
The second tab is labelled “Catalogue” and reports the earthquake parameters included in GHEC (Fig. 8).
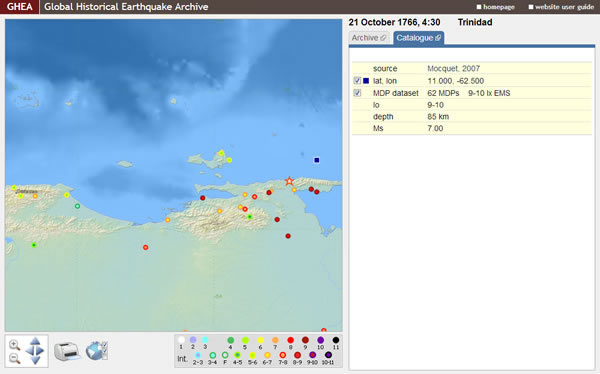
Fig. 8 - Detailed view of the Catalogue contents related to
the 21 October 1766 earthquake, Trinidad
Finally, it is possible to open the tabs of the two sections (“Archive” and “Catalogue”) at the same time by clicking the icon (![]() ) inside each label.
) inside each label.