Macroseismic Intensity Data Online Publisher


Advanced customisations
MIDOP is by nature extensively customizable. Whenever you find a button “Edit”, by clicking it you will be able to directly modify the source code using a built-in source code editor.
Off course such modifications requires at least a basic PHP and HTML coding knowledge, but also novice users might understand it by reading existing code. A big effort while developing MIDOP is being putted on the coding style adopted: extensive use of comments, PHP variable with self-explaining names and simple text files for storing each managed website settings.
Symbols customization
Available symbols used for plotting macroseismic intensities can be customized and new symbols can also be created by clicking the button “Edit” within the page “MDP map”: a popup window will open presenting a source code editor.
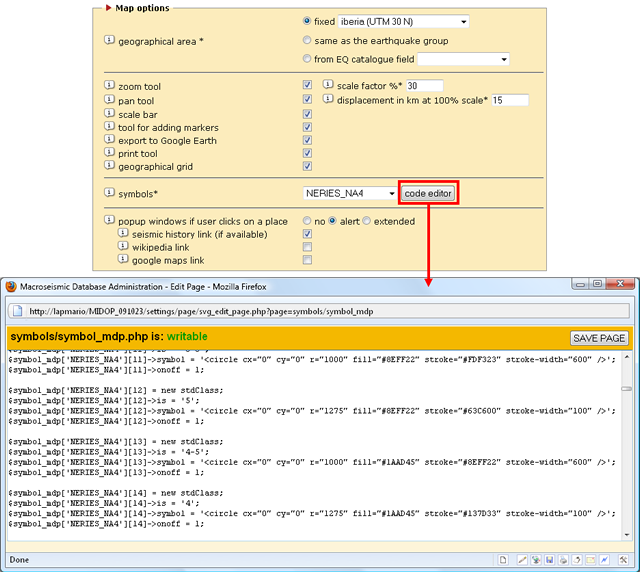
The code uses PHP macro-language for defining SVG (Scalable Vector Graphic) shapes.
Be careful while inserting or modifying PHP source code:
errors might produce unpredictable effects and might completely harm MIDOP.
Have a look at the PHP coding standards and *DO* make a backup of your data!
Intensity symbols are organized in sets, each with as many symbols as the possible range of macroseismic intensities. Each intensity symbol within a set is defined using again four lines:
- third level array object class creation named using a progressive integer as the unique identifier within the set. The array intensity so defined it’s contained in an array called as the name of the set, in its turn contained in another array called “$symbol_mdp” (e.g.: $symbol_mdp[‘name_of_the_set’][‘intensity value’]). Note that the set name must not contains spaces nor special characters
- definition of the macroseismic intensity value for which the symbol will be used. Note that the specified intensity notation must be identical to the intensity notation used for the compilation of the input data. If for example the symbol says that it must be used for values “6-7” but the input data is compiled with a “VI-VII” or “6.5” the symbol will not be used;
- SVG shape definition code. Note that symbols must be inscribed in an rectangle of 3000 by 3000 in order to be homogenous;
- define if the symbol will be used when creating the final map SVG code. This is useful in order to turn on (“1”) or off (“0”) plotted symbols without the need of deleting the symbol code.
The built-in symbol sets used for representing MDP on a map are contained in the php file “settings \ symbols \ symbol_mdp.php”
Below the source code used for defining the 9th symbol of the “NERIES_NA4” set defining the represented intensity “4-5”:
$symbol_mdp['NERIES_NA4'][9] = new stdClass;
$symbol_mdp['NERIES_NA4'][9]->is = '4-5';
$symbol_mdp['NERIES_NA4'][9]->symbol = '<circle cx="0" cy="0" r="1000" fill="#FDF323" stroke="#FF963F" stroke-width="600" />';
$symbol_mdp['NERIES_NA4'][9]->onoff = 1;
A problem occurs if the original macroseismic intensity data adopts intensity diction that doesn’t match the defined intensity symbol set. If MIDOP found the intensity “IV-V” and a symbol linked to this intensity doesn’t exists the intensity point will simply not be rendered on the map.
In order to solve this problem you can automatically convert your custom intensity values instead of changing the whole intensity symbols set or altering the data contained in the intensity tables.
This conversion is based on the file “settings \ symbols \ symbol_conversion.php”. If for example you would like to convert the roman value “V-VI” into “5-6” two lines of code must be inserted:
$symbol_convert_cases[] = 'IV-V';
$symbol_convert_value[] = '4-5';
You can specify multiple conversion at once, so, if you would like to convert both the original values “V-VI” and “5.5” into “5-6” write something like:
$symbol_convert_cases[] = '4.5|IV-V';
$symbol_convert_value[] = '4-5';
Epicentre symbols are defined by four PHP lines:
- second level array object class creation named as the name of the symbol. The so created array in its turn is contained in another array called “$symbol_epicentre” (e.g.: $symbol_epicentre[‘name_of_the_symbol’]). Note that the symbol name must not contains spaces nor special characters;
- unique identifier definition. Note that the code of the map is written in SVG and the specified identifier of each object must be unique in order to let the JavaScript command “getElementById()” operating correctly on the DOM (Document Object Model);
- SVG shape definition code. Note that symbols must be inscribed in an rectangle of 3000 by 3000 in order to be homogenous;
- define if the symbol will be used when creating the final map SVG code. This is useful in order to turn on (“1”) and off (“0”) plotted symbols without the need of deleting the symbol itself.
Below the source code used for defining the rectangle:
  $symbol_epicentre['SquareBlack'] = new stdClass;
  $symbol_epicentre['SquareBlack']->id = 'idSquareBlack';
  $symbol_epicentre['SquareBlack']->symbol = '<rect x="-1500" y="-1500" width="3000" height="3000" stroke="#000000" stroke-width="500" fill="#FFFFFF" />';
  $symbol_epicentre['SquareBlack']->onoff = 1;
Custom layers
Geographical layers in MODOP are plain text files containing SVG elements. Before trying to create such files you can find further information on the SVG specifications at the W3C website (http://www.w3.org/TR/SVG/).
Layers are stored in the folder “data” separately for the general earthquake map and for single earthquake intensity maps, and for each UTM zone and covered area following this structure:
- earthquakes maps: “data \ layers_eq \”
- UTM zone 28: “data \ layers_eq \ 28”:
- Atlantic Islands: “data \ layers_eq \ 28 \ atlantic_islands”;
- UTM zone 30: “data \ layers_eq \ 30”:
- Iberian layers: “data \ layers_eq \ 30 \ iberia”;
- UK layers: “data \ layers_eq \ 30 \ uk”;
- UTM zone 31: “data \ layers_eq \ 31”:
- France layers: “data \ layers_eq \ 31 \ france”;
- UTM zone 32: “data \ layers_eq \ 32”:
- Italian layers: “data \ layers_eq \ 32 \ italy”;
- entire Europe layers: “data \ layers_eq \ 32 \ whole_europe”;
- UTM zone 33: “data \ layers_eq \ 33”:
- Eastern Europe layers: “data \ layers_eq \ 33 \ eastern_europe”;
- Fennoscandia layers: “data \ layers_eq \ 33 \ fennoscandia”;
- UTM zone 34: “data \ layers_eq \ 34”:
- Aegean layers: “data \ layers_eq \ 34 \ aegean”;
An identical file structure is used for storing geographical layers for earthquake intensity maps in folder “data \ layers_mdp \”.
Layers files must follow some important rule:
- each layer file must contains only SVG elements of the same kind (e.g. only “path”, only “rect” or only “circle”);
- no groups must be present (no “<g>” elements);
- no “styles” must be specified.
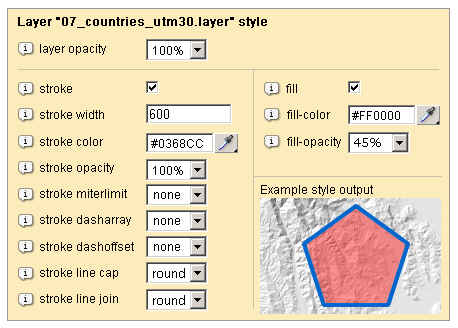
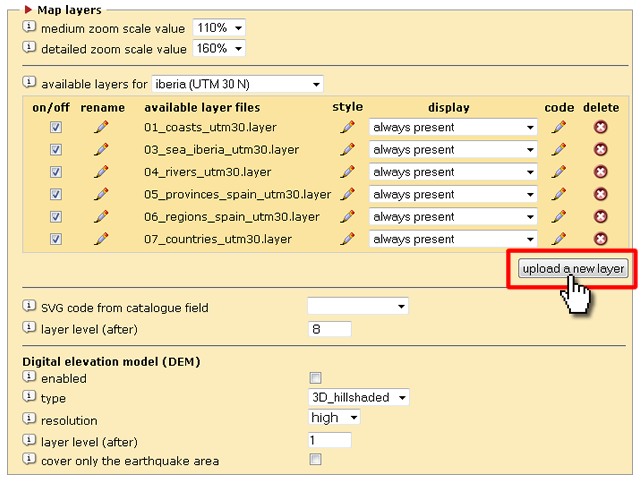
Styling the layer is possible within the dedicated control panel window (below) available both for layers in the “EQ map” and “MDP map” page. Through the visual interface can specify both the fill and the stroke style and the layer opacity (transparency).
New geographical layers can be created for example from ESRI shapefiles (“.shp” extension).
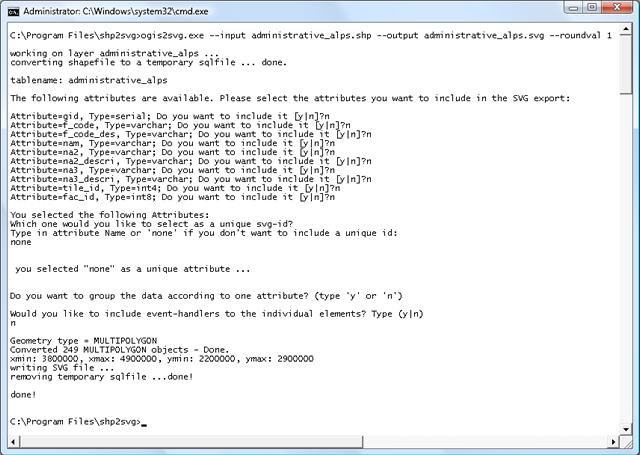
These files must be already projected using the corresponding UTM zone to the geographical area where they are going to be used. The conversion can be done using the freely available “shp2svg” [Neumann, 2007] utility at the CartoNet website (http://carto.net/papers/svg/utils/shp2svg/) composed by two MS Windows executables “ogis2svg.exe” and “shp2pgsql.exe” that works in the Windows Command Prompt. The conversion is done entering the following command:
ogis2svg.exe --input your_shapefile --output svg_output_file.svg --roundval 1
When asked, answer “n” to every question. Below an example output of the conversion of the shapefile called “administrative_alps.shp”:
At the end of the conversion process, the output generated SVG file can be found in the same folder. In order to use such file in MIDOP as a geographical layer you must open the SVG file in a text editor and delete all the lines that don’t contain SVG elements and save the file with the “.layer” extension.
Below an example screenshot with the converted “administrative_alps.svg” file loaded into a text editor (enlighten in blue lines that must be deleted):
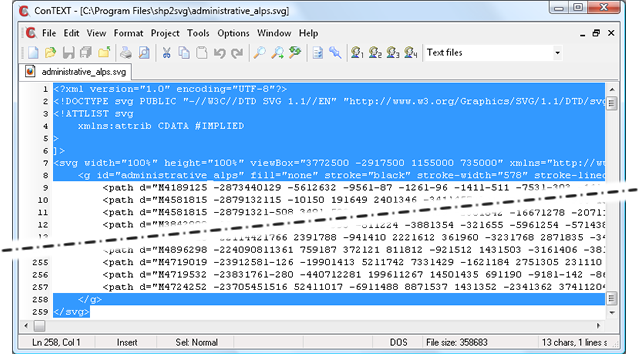
Once you have your file with the “.layer” extension you can upload it into MIDOP by clicking the button “upload a new layer” in the control panel.
Please, note that MIDOP will load the layer file as is and no geographical projection or other transformation will be performed.
For simple changes to the layers source code a text editor can fulfill the task.
If complicated SVG manipulation is required, you can use the freely available graphic tool Inkscape (http://www.inkscape.org/) which uses SVG as its native format of manipulating graphical object. Once you’ve done your changes within Inkscape remember to save the file as “plain SVG code” and, again, strip off all the unnecessary SVG lines of code.
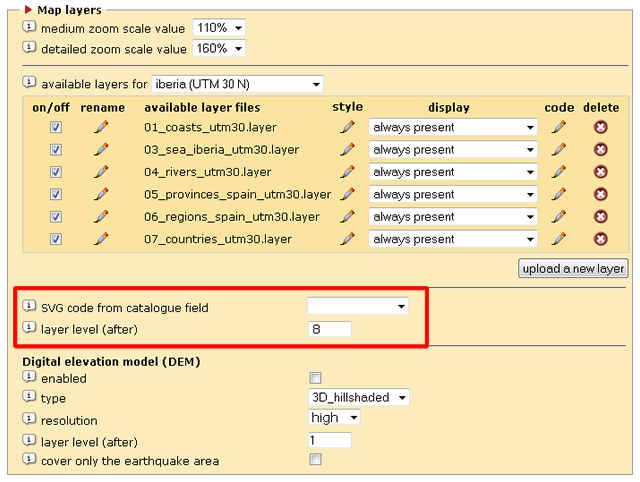
Loading custom objects on selected earthquakes
MIDOP can load custom SVG objects that will be rendered in selected earthquakes. In order to obtain such feature you have to create a dedicated field within the earthquake catalogue table in which your SVG custom code will be stored. You then need to tell MIDOP to load such SVG code by selecting the created field in the “MDP page” at “SVG code from catalogue field” (see below) and specify at which layer level MIDOP will render it.