Macroseismic Intensity Data Online Publisher
Symbol set for epicentres (when in overview map)
MIDOP comes with some set of predefined symbols for plotting epicentres in the overview map that appears when entering the "query by earthquake" section.
MIDOP consider two cases: plotting earthquakes 1) with an associated magnitude value or 2) without a magnitude value.
Case 1)
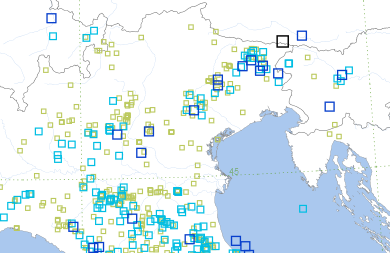
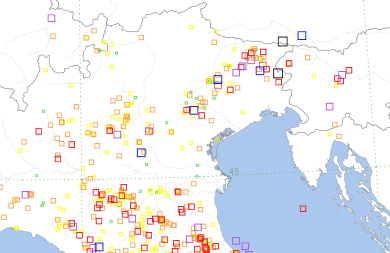
When the magnitude field is set, you can choose among one of the following sets:
| Symbol set name | Example |
|
Extra large, large, medium and small Magnitude ranges: |
 |
|
DBMI04 Magnitude ranges: |
 |
Case 2)
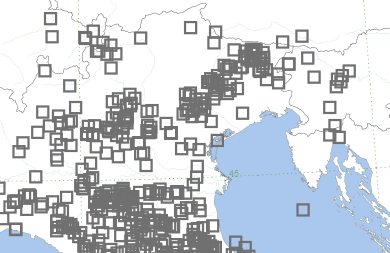
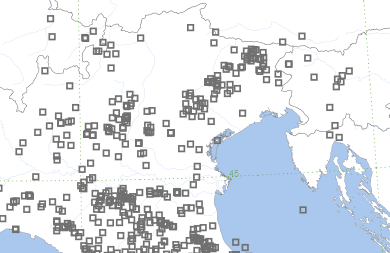
When the magnitude field is not set, you can choose among on of the following sets:
| Symbol set name | Example |
|
Gray squares |
 |
|
Gray small squares |
 |
It is possible to customize the existing sets or even create new symbol sets by editing the PHP/SVG source code.
To do so, press the button "code editor" beside the "symbol set for epicentres" in the control panel page "EQ map".
Each symbol is coded using pure SVG. Each symbol shape must be contained in a 20000x20000 square.
In order to add a custom epicentre you should add the code below.
To define the first symbol of the set:
$symbol_epicentre['symbol_set_name'][0] = new stdClass;
$symbol_epicentre['symbol_set_name'][0]->is = 'value';
$symbol_epicentre['symbol_set_name'][0]->symbol = 'SVG code';
$symbol_epicentre['symbol_set_name'][0]->onoff = 1; // 1=PLOTTED, 0=NOT PLOTTED
If for example you would like to define a symbol for representing a range of magnitude values between 5.5 and 6.5:
$symbol_epicentre['symbol_set_name'][0]->is = '5.5-6.5';
Additional ranges are defined adding a new symbol in the same set:
$symbol_epicentre['symbol_set_name'][previous_index_number+1] = new stdClass;
$symbol_epicentre['symbol_set_name'][previous_index_number+1]->is = 'additional range';
$symbol_epicentre['symbol_set_name'][previous_index_number+1]->symbol = 'SVG code';
$symbol_epicentre['symbol_set_name'][previous_index_number+1]->onoff = 1; // 1=PLOTTED, 0=NOT PLOTTED
When you don't have a magnitude value, all epicentres will be plotted using one symbol only, in such case use:
$symbol_epicentre['symbol_set_name'][0]->is = 'fake';


